

Washington Commanders

CONF. RANKCONFERENCE RANK
15THPlayoff Probability


Playoff Probability
Offense

Defense

TEAM IDENTITY
OFFENSIVE IDENTITY
Team tendency statistics for Commanders, grouped by category.
- 11P
- 63% How the Commanders compare to the rest of the league on 11 personnel.
- 12P
- 20% How the Commanders compare to the rest of the league on 12 personnel.
- 13P
- 12% How the Commanders compare to the rest of the league on 13 personnel.
- 21P
- 1% How the Commanders compare to the rest of the league on 21 personnel.
- CALLED PASS
- 64% How the Commanders compare to the rest of the league on called pass rate.
- PLAY ACTION
- 31% How the Commanders compare to the rest of the league on early down play action.
- MOTION
- 61% How the Commanders compare to the rest of the league on motion.
- TEMPO
- 34.3s How the Commanders compare to the rest of the league on tempo.
- QUICK PASS
- 38% How the Commanders compare to the rest of the league on quick passing.
- IN-BREAKING
- 35% How the Commanders compare to the rest of the league on in-breaking targets.
- OUT-BREAKING
- 27% How the Commanders compare to the rest of the league on out-breaking targets.
- 10+ AIR YARDS
- 34% How the Commanders compare to the rest of the league on downfield passing.
- INSIDE ZONE
- 18% How the Commanders compare to the rest of the league on inside zone.
- OUTSIDE ZONE
- 49% How the Commanders compare to the rest of the league on outside zone.
- GAP
- 14% How the Commanders compare to the rest of the league on gap blocking.
- MAN
- 17% How the Commanders compare to the rest of the league on man blocking.
- Offensive Personnel
- Play Selection

- Rushing Offense
- Passing Offense
| TRAIT | USAGE | Percentile | RANK | Details |
|---|---|---|---|---|
| 49% | 96th | 1st | ||
| 64% | 82nd | 8th | ||
| 63% | 73rd | 7th |
| TEAM | SIMILARITY | |
|---|---|---|
 | CAROLINA PANTHERS | 82% |
 | GREEN BAY PACKERS | 80% |
 | ATLANTA FALCONS | 78% |



TEAM PERFORMANCE
POINT DIFFERENTIAL
- POINT DIFFERENTIAL
- NET EPA
- LEAGUE AVG

| WEEK | 7 | 10 | 11 | 12 | 13 | 14 | 15 | 16 | 17 | 18 | ||||||||
|---|---|---|---|---|---|---|---|---|---|---|---|---|---|---|---|---|---|---|
| OPP | @  Loss22-24 | @  Loss20-37 | vs  Win33-31 | vs  Loss13-30 | vs  Tie27-27 | @  Loss17-23 | Bye week | vs Win27-10 | vs  Loss13-20 | @ Not played yet | vs  Not played yet | @  Not played yet | @  Not played yet | vs  Not played yet | vs  Not played yet | @  Not played yet | @  Not played yet | vs Not played yet |
| NET EPA | -0.9 | -11.5 | -0.8 | -13.8 | +3.0 | -15.2 | No data | +16.5 | -5.8 | No data | No data | No data | No data | No data | No data | No data | No data | No data |
| PT DIFF | -2 | -17 | 2 | -17 | 0 | -6 | No data | 17 | -7 | No data | No data | No data | No data | No data | No data | No data | No data | No data |



AWS-powered AI helps turn player tracking data into advanced stats and deeper football insights you can explore in Next Gen Trends.
- 01COLLECTWatch: Capturing Every Snap
NFL Next Gen Stats tracks all 22 players and the ball, collecting more than 500 million data points each season to capture the movement behind every play.
- 02PROCESSWatch: From Snap to Stat
The NFL uses Amazon SageMaker to build machine learning models that turn raw tracking data into advanced stats that reveal how players and teams perform.
- 03DISTRIBUTEWatch: NGS Explained
Next Gen Trends brings those stats together to help fans compare all 32 teams, explore their strategies and track how the league evolves over time.

LATEST INSIGHTS
Explore the latest team trends and standout performances with insights from Next Gen Stats available only on NFL Pro.
JAYDEN DANIELS QB #5 - WAS vs
Jayden Daniels completed 16 of his 29 pass attempts for 217 yards and a touchdown in the Commanders' Week 8 win against the Eagles.More than two-thirds of that yardage came against man coverage, where he completed eight of 13 passes for a career-high 148 yards and a touchdown. Daniels was successful generating chunk plays, completing all three of his deep attempts (20+ air yards) for 104 yards, his most in a game since Week 8 of 2024 against the Bears. He added another 23 yards with his legs on two scrambles.
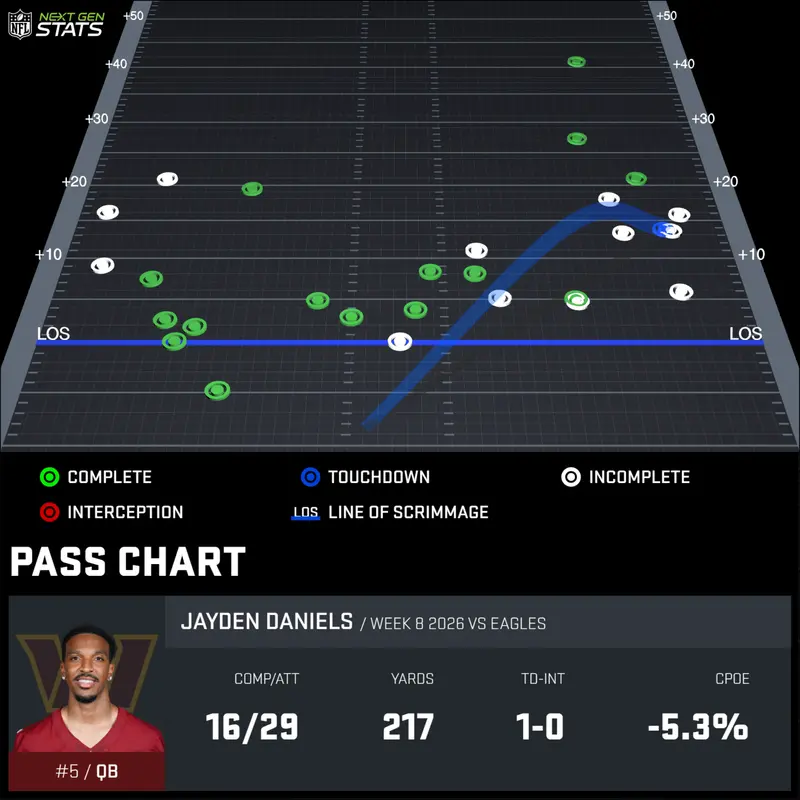
WEEK 8
NOV 1ST, 2026
vs
The Commanders generated pressure on 46.5% of dropbacks against the Eagles in Week 8, a season-high mark.They generated 10 pressures and a sack on 12 blitzes (83.3%), the second-highest pressure rate by any defense in a game this season (min. 5 blitzes). Washington forced a season-high seven quick pressures (under 2.5 seconds) on their blitzes. While they produced just a 32.3% pressure rate when not blitzing, they did record four sacks rushing four or fewer.

WEEK 8
NOV 1ST, 2026
K'LAVON CHAISSON OLB #45 - WAS vs
K'Lavon Chaisson generated a season-high seven pressures and a sack on 28 pass rushes in Week 8 against the Eagles, his second-most pressures in a game in his career.Much of that work came against Markel Bell, as Chaisson recorded three pressures and his lone sack across 18 matchups, including two quick pressures (under 2.5 seconds).
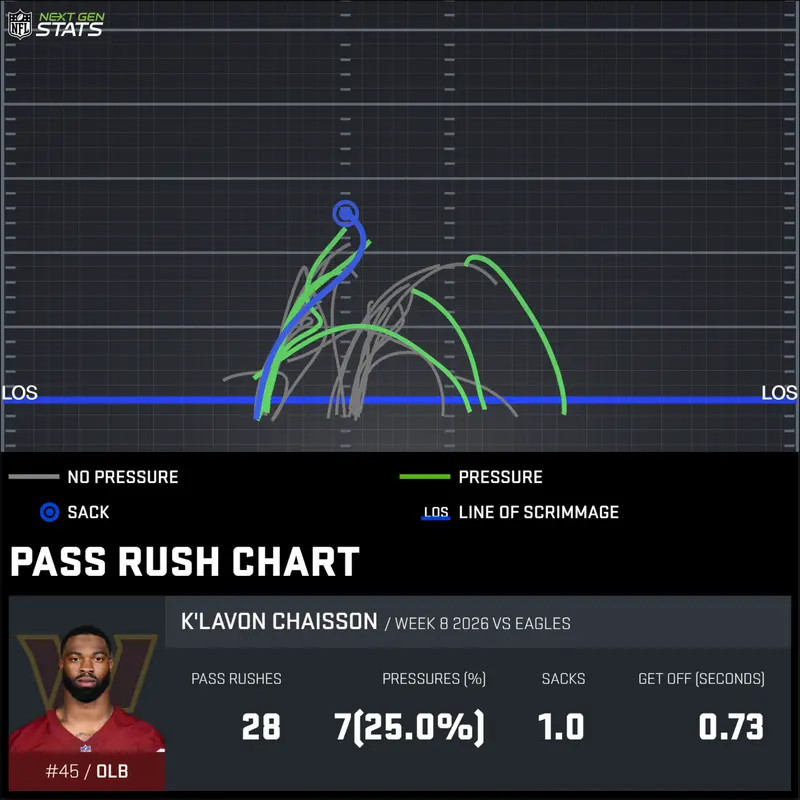
WEEK 8
NOV 1ST, 2026
TREYLON BURKS WR #13 - WAS vs
Treylon Burks caught 4 of his 6 targets for 66 yards against the Commanders, recording a team high 2.4 yards per route run (minimum 5 routes).This is his most yards in a game since Week 2 of the 2023 season (Chargers, 76). His 59 completed air yards were the most on the team, 20 air yards more than second-place Antonio Williams (39).
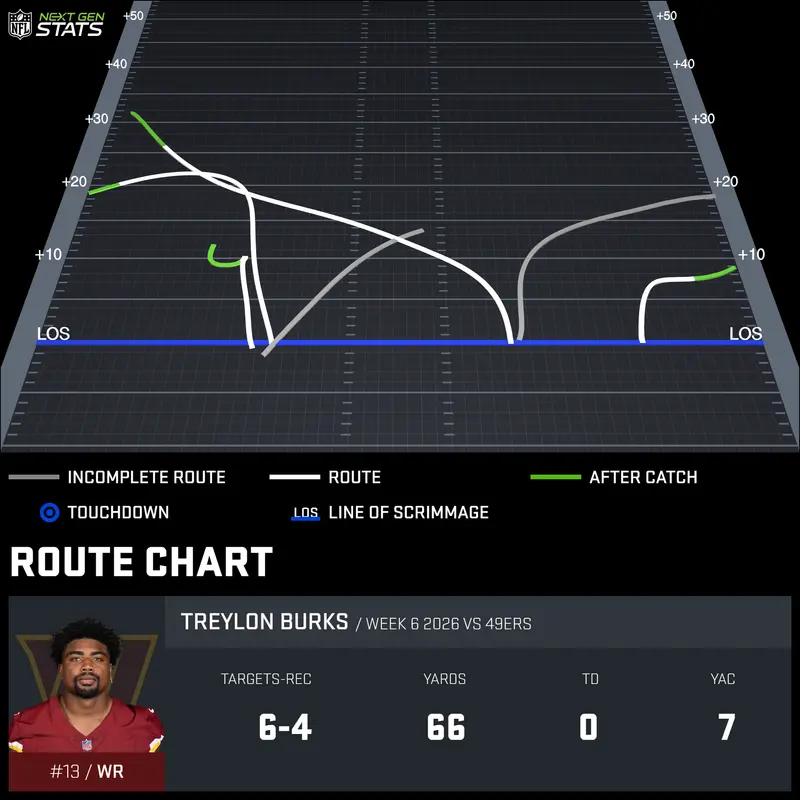
WEEK 6
OCT 19TH, 2026


GIANTS
5-2-13RD SEED
- PLAYOFFPLAYOFF PROBABILITY
- 65%
- DIVISION TITLE
- 63%
- #1 SEED
- 2%
OFFENSE- EPA/PLAY
- -0.06
- PPG
- 22.8
- YPG
- 333.1
DEFENSE- EPA/PLAY
- -0.10
- OPP PPG
- 21.5
- OPP YPG
- 301.4
COWBOYS
4-510TH SEED
- PLAYOFFPLAYOFF PROBABILITY
- 28%
- DIVISION TITLE
- 26%
- #1 SEED
- <1%
OFFENSE- EPA/PLAY
- +0.06
- PPG
- 27.3
- YPG
- 360.4
DEFENSE- EPA/PLAY
- +0.05
- OPP PPG
- 26.2
- OPP YPG
- 372.7
COMMANDERS
2-5-115TH SEED
- PLAYOFFPLAYOFF PROBABILITY
- 11%
- DIVISION TITLE
- 10%
- #1 SEED
- 0%
OFFENSE- EPA/PLAY
- -0.09
- PPG
- 21.5
- YPG
- 325.4
DEFENSE- EPA/PLAY
- -0.03
- OPP PPG
- 25.3
- OPP YPG
- 342.3
EAGLES
2-716TH SEED
- PLAYOFFPLAYOFF PROBABILITY
- <1%
- DIVISION TITLE
- <1%
- #1 SEED
- 0%
OFFENSE- EPA/PLAY
- -0.22
- PPG
- 16.4
- YPG
- 260.2
DEFENSE- EPA/PLAY
- +0.02
- OPP PPG
- 24.6
- OPP YPG
- 353.4


