

Minnesota Vikings

CONF. RANKCONFERENCE RANK
6THPlayoff Probability


Playoff Probability
Offense

Defense

TEAM IDENTITY
OFFENSIVE IDENTITY
Team tendency statistics for Vikings, grouped by category.
- 11P
- 58% How the Vikings compare to the rest of the league on 11 personnel.
- 12P
- 18% How the Vikings compare to the rest of the league on 12 personnel.
- 13P
- 1% How the Vikings compare to the rest of the league on 13 personnel.
- 21P
- 15% How the Vikings compare to the rest of the league on 21 personnel.
- CALLED PASS
- 58% How the Vikings compare to the rest of the league on called pass rate.
- PLAY ACTION
- 43% How the Vikings compare to the rest of the league on early down play action.
- MOTION
- 62% How the Vikings compare to the rest of the league on motion.
- TEMPO
- 35.8s How the Vikings compare to the rest of the league on tempo.
- QUICK PASS
- 40% How the Vikings compare to the rest of the league on quick passing.
- IN-BREAKING
- 28% How the Vikings compare to the rest of the league on in-breaking targets.
- OUT-BREAKING
- 29% How the Vikings compare to the rest of the league on out-breaking targets.
- 10+ AIR YARDS
- 35% How the Vikings compare to the rest of the league on downfield passing.
- INSIDE ZONE
- 20% How the Vikings compare to the rest of the league on inside zone.
- OUTSIDE ZONE
- 31% How the Vikings compare to the rest of the league on outside zone.
- GAP
- 16% How the Vikings compare to the rest of the league on gap blocking.
- MAN
- 29% How the Vikings compare to the rest of the league on man blocking.
- Offensive Personnel
- Play Selection

- Rushing Offense
- Passing Offense
| TRAIT | USAGE | Percentile | RANK | Details |
|---|---|---|---|---|
| 43% | 94th | 3rd | ||
| 15% | 85th | 4th | ||
| 35% | 76th | 8th |
| TEAM | SIMILARITY | |
|---|---|---|
 | NEW YORK JETS | 77% |
 | MIAMI DOLPHINS | 76% |
 | SEATTLE SEAHAWKS | 76% |



TEAM PERFORMANCE
POINT DIFFERENTIAL
- POINT DIFFERENTIAL
- NET EPA
- LEAGUE AVG

| WEEK | 6 | 10 | 11 | 12 | 13 | 14 | 15 | 16 | 17 | 18 | ||||||||
|---|---|---|---|---|---|---|---|---|---|---|---|---|---|---|---|---|---|---|
| OPP | vs  Win39-22 | @  Win9-3 | @  Win23-16 | vs  Win15-10 | @  Win23-13 | Bye week | vs  Win16-10 | @  Loss15-19 | vs  Loss6-23 | @ Not played yet | @  Not played yet | vs  Not played yet | vs  Not played yet | @  Not played yet | vs Not played yet | vs  Not played yet | @  Not played yet | vs Not played yet |
| NET EPA | +11.5 | +3.2 | -1.5 | +7.8 | +6.1 | No data | +2.7 | -6.3 | -29.4 | No data | No data | No data | No data | No data | No data | No data | No data | No data |
| PT DIFF | 17 | 6 | 7 | 5 | 10 | No data | 6 | -4 | -17 | No data | No data | No data | No data | No data | No data | No data | No data | No data |



AWS-powered AI helps turn player tracking data into advanced stats and deeper football insights you can explore in Next Gen Trends.
- 01COLLECTWatch: Capturing Every Snap
NFL Next Gen Stats tracks all 22 players and the ball, collecting more than 500 million data points each season to capture the movement behind every play.
- 02PROCESSWatch: From Snap to Stat
The NFL uses Amazon SageMaker to build machine learning models that turn raw tracking data into advanced stats that reveal how players and teams perform.
- 03DISTRIBUTEWatch: NGS Explained
Next Gen Trends brings those stats together to help fans compare all 32 teams, explore their strategies and track how the league evolves over time.

LATEST INSIGHTS
Explore the latest team trends and standout performances with insights from Next Gen Stats available only on NFL Pro.
ANDREW VAN GINKEL OLB #43 - MIN vs
Andrew Van Ginkel pressured Josh Allen five times in the Vikings' Week 9 loss to the Bills, tied for his most in a game this season.Van Ginkel paired that with four quarterback hits, tied for his most ever in a game. Van Ginkel was one of four Vikings defenders to earn a pressure against Tylan Grable who replaced the injured Dion Dawkins at left tackle.
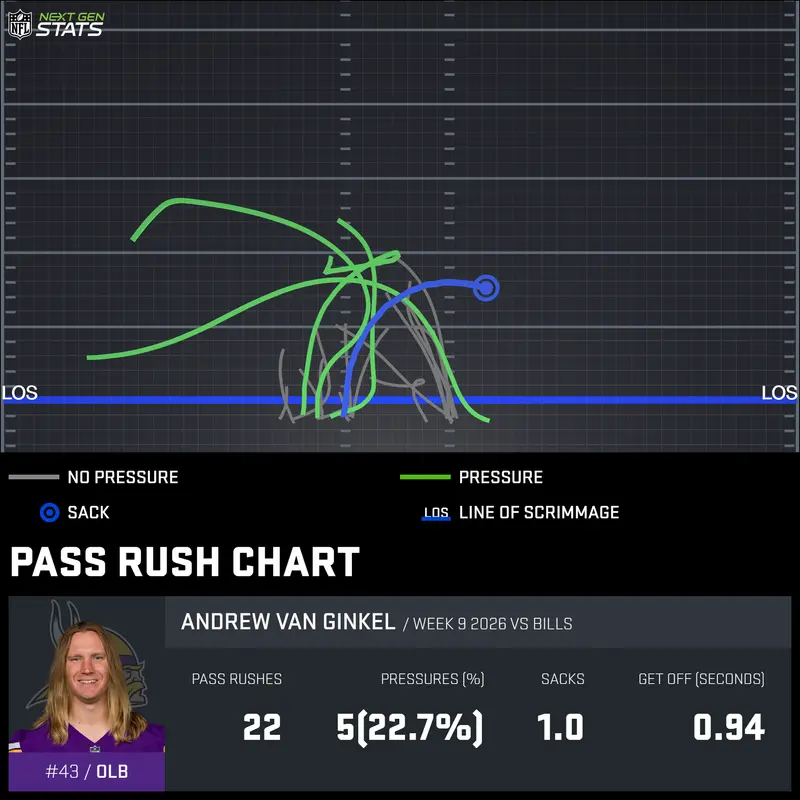
WEEK 9
NOV 9TH, 2026
KYLER MURRAY QB #1 - MIN vs
Kyler Murray threw for 210 yards, two touchdowns and one interception in the Vikings' Week 8 loss against the Lions.Murray averaged 11.2 air yards per attempt, his second-highest mark in a game, trailing only a Week 3, 2024 matchup against the Lions (11.6). Murray targeted downfield (10+ air yards) on 44.8% of his attempts, his second-highest rate as a Viking. On downfield attempts, Murray threw for a season-high 115 yards despite only completing 4-of-13 attempts (30.8%), his lowest downfield completion rate in a game since 2023 (min. 10 downfield attempts).
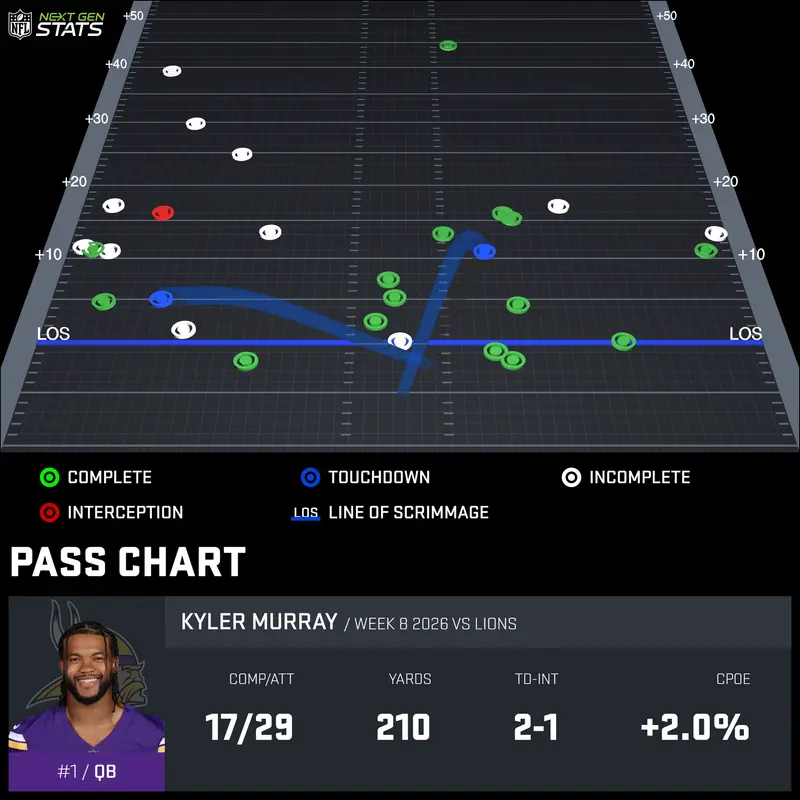
WEEK 8
NOV 1ST, 2026
vs
The Vikings blitzed on 85.2% of Daniel Jones' dropbacks against the Colts in Week 7, the highest blitz rate by any defense in a game in the Next Gen Stats era (since 2016).Minnesota generated pressure on 60.9% of those blitzes, with all four its sacks coming when blitzing.

WEEK 7
OCT 25TH, 2026
DALLAS TURNER OLB #15 - MIN vs
Dallas Turner generated six pressures on 18 pass rushes against the Colts on Sunday, including three on five pass rushes against Bernhard Raimann.Turner has generated 39 pressures this season, the second-most in the NFL behind Will Anderson Jr. (41) on one less game played.
WEEK 7
OCT 25TH, 2026


BEARS
7-22ND SEED
- PLAYOFFPLAYOFF PROBABILITY
- 83%
- DIVISION TITLE
- 30%
- #1 SEED
- 17%
OFFENSE- EPA/PLAY
- -0.02
- PPG
- 26.8
- YPG
- 383.0
DEFENSE- EPA/PLAY
- -0.14
- OPP PPG
- 20.4
- OPP YPG
- 310.9
LIONS
6-25TH SEED
- PLAYOFFPLAYOFF PROBABILITY
- 83%
- DIVISION TITLE
- 38%
- #1 SEED
- 21%
OFFENSE- EPA/PLAY
- +0.07
- PPG
- 27.8
- YPG
- 379.8
DEFENSE- EPA/PLAY
- +0.05
- OPP PPG
- 23.6
- OPP YPG
- 355.0
VIKINGS
6-26TH SEED
- PLAYOFFPLAYOFF PROBABILITY
- 73%
- DIVISION TITLE
- 21%
- #1 SEED
- 11%
OFFENSE- EPA/PLAY
- -0.20
- PPG
- 18.3
- YPG
- 266.8
DEFENSE- EPA/PLAY
- -0.18
- OPP PPG
- 14.5
- OPP YPG
- 280.0
PACKERS
6-37TH SEED
- PLAYOFFPLAYOFF PROBABILITY
- 62%
- DIVISION TITLE
- 11%
- #1 SEED
- 4%
OFFENSE- EPA/PLAY
- -0.02
- PPG
- 24.0
- YPG
- 347.9
DEFENSE- EPA/PLAY
- -0.13
- OPP PPG
- 21.2
- OPP YPG
- 322.9


