

Houston Texans

CONF. RANKCONFERENCE RANK
11THPlayoff Probability


Playoff Probability
Offense

Defense

TEAM IDENTITY
OFFENSIVE IDENTITY
Team tendency statistics for Texans, grouped by category.
- 11P
- 63% How the Texans compare to the rest of the league on 11 personnel.
- 12P
- 11% How the Texans compare to the rest of the league on 12 personnel.
- 13P
- 8% How the Texans compare to the rest of the league on 13 personnel.
- 21P
- 0% How the Texans compare to the rest of the league on 21 personnel.
- CALLED PASS
- 63% How the Texans compare to the rest of the league on called pass rate.
- PLAY ACTION
- 31% How the Texans compare to the rest of the league on early down play action.
- MOTION
- 62% How the Texans compare to the rest of the league on motion.
- TEMPO
- 35.3s How the Texans compare to the rest of the league on tempo.
- QUICK PASS
- 42% How the Texans compare to the rest of the league on quick passing.
- IN-BREAKING
- 39% How the Texans compare to the rest of the league on in-breaking targets.
- OUT-BREAKING
- 22% How the Texans compare to the rest of the league on out-breaking targets.
- 10+ AIR YARDS
- 40% How the Texans compare to the rest of the league on downfield passing.
- INSIDE ZONE
- 10% How the Texans compare to the rest of the league on inside zone.
- OUTSIDE ZONE
- 23% How the Texans compare to the rest of the league on outside zone.
- GAP
- 32% How the Texans compare to the rest of the league on gap blocking.
- MAN
- 20% How the Texans compare to the rest of the league on man blocking.
- Offensive Personnel
- Play Selection

- Rushing Offense
- Passing Offense
| TRAIT | USAGE | Percentile | RANK | Details |
|---|---|---|---|---|
| 40% | 96th | 2nd | ||
| 32% | 95th | 2nd | ||
| 63% | 79th | 9th |
| TEAM | SIMILARITY | |
|---|---|---|
 | WASHINGTON COMMANDERS | 76% |
 | TENNESSEE TITANS | 76% |
 | JACKSONVILLE JAGUARS | 73% |



TEAM PERFORMANCE
POINT DIFFERENTIAL
- POINT DIFFERENTIAL
- NET EPA
- LEAGUE AVG

| WEEK | 8 | 10 | 11 | 12 | 13 | 14 | 15 | 16 | 17 | 18 | ||||||||
|---|---|---|---|---|---|---|---|---|---|---|---|---|---|---|---|---|---|---|
| OPP | vs  Loss31-36 | vs  Loss6-20 | @  Loss17-19 | vs  Loss30-34 | @  Win26-3 | @  Win34-31 | vs  Loss21-27 | Bye week | @  Win44-22 | @  Not played yet | vs Not played yet | vs  Not played yet | @  Not played yet | @  Not played yet | vs Not played yet | @  Not played yet | @  Not played yet | vs Not played yet |
| NET EPA | -5.9 | -11.1 | +2.2 | +4.9 | +31.4 | +1.8 | -16.1 | No data | +25.3 | No data | No data | No data | No data | No data | No data | No data | No data | No data |
| PT DIFF | -5 | -14 | -2 | -4 | 23 | 3 | -6 | No data | 22 | No data | No data | No data | No data | No data | No data | No data | No data | No data |



AWS-powered AI helps turn player tracking data into advanced stats and deeper football insights you can explore in Next Gen Trends.
- 01COLLECTWatch: Capturing Every Snap
NFL Next Gen Stats tracks all 22 players and the ball, collecting more than 500 million data points each season to capture the movement behind every play.
- 02PROCESSWatch: From Snap to Stat
The NFL uses Amazon SageMaker to build machine learning models that turn raw tracking data into advanced stats that reveal how players and teams perform.
- 03DISTRIBUTEWatch: NGS Explained
Next Gen Trends brings those stats together to help fans compare all 32 teams, explore their strategies and track how the league evolves over time.

LATEST INSIGHTS
Explore the latest team trends and standout performances with insights from Next Gen Stats available only on NFL Pro.
C.J. STROUD QB #7 - HOU vs
C.J. Stroud completed 10-of-16 passes between 10 and 19 yards downfield for 254 yards, five touchdowns, and an interception in Week 9 against the Chargers.It is the only game in which a quarterback has thrown five touchdowns targeting the intermediate level since at least 2016 and the third-most yards recorded by a quarterback on such throws in that span.
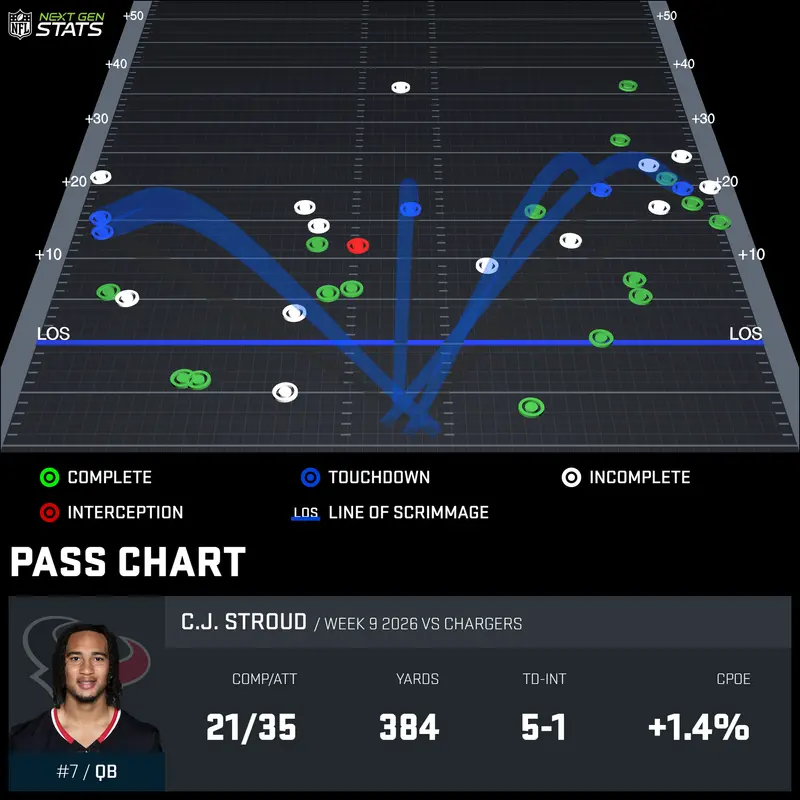
WEEK 9
NOV 8TH, 2026
DANIELLE HUNTER DE #55 - HOU vs
Danielle Hunter generated a season-high eight pressures and five quick pressures in Week 9 against the Chargers.His eight pressures tie his single-game high since 2025, and his five quick pressures are the most he has recorded in that span. Hunter generated three quick pressures in seven matchups against Travis Burke and was the only Texans defender to record a pressure against Joe Alt, generating two across 16 matchups.
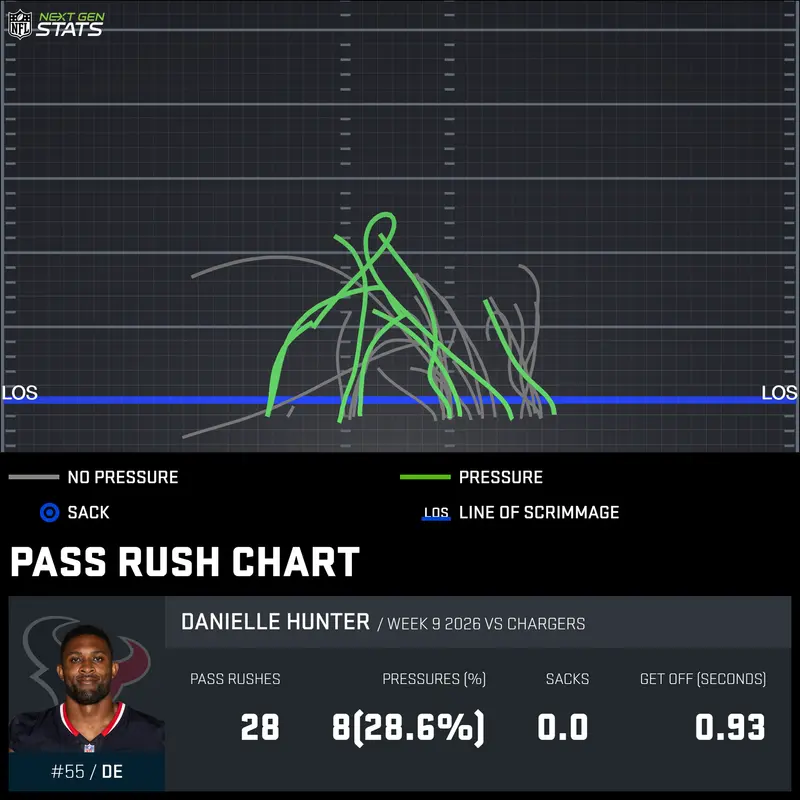
WEEK 9
NOV 8TH, 2026
KAMARI LASSITER CB #3 - HOU vs
In the Texans' Week 9 win over the Chargers, Kamari Lassiter did not allow a reception on his five targets — the most targets he has faced in a game without allowing a reception — recording a career-high four passes defensed.In his 10 man coverage snaps, Lassiter was targeted twice and recorded two passes defensed, only the second game in his career he has recorded multiple passes defensed while in man coverage.

WEEK 9
NOV 8TH, 2026
DANIELLE HUNTER DE #55 - HOU vs
Danielle Hunter generated five pressures, two quick pressures, and a sack in Week 7.Hunter averaged a time to pressure of 2.56 seconds, his quickest in a game since 2023 (min. 5 pressures).
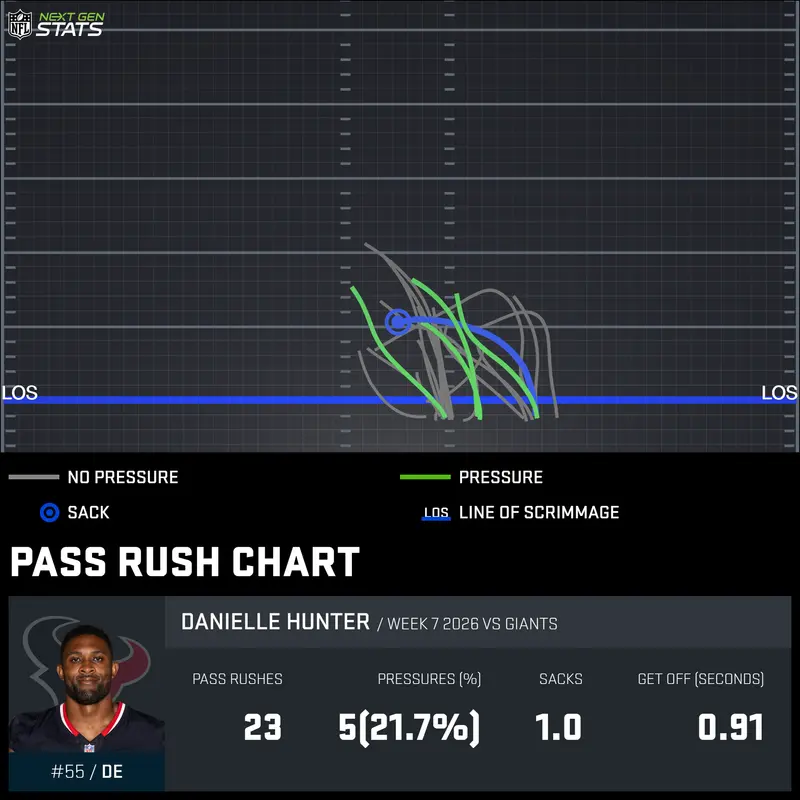
WEEK 7
OCT 25TH, 2026


JAGUARS
6-23RD SEED
- PLAYOFFPLAYOFF PROBABILITY
- 97%
- DIVISION TITLE
- 91%
- #1 SEED
- 14%
OFFENSE- EPA/PLAY
- +0.09
- PPG
- 28.6
- YPG
- 346.4
DEFENSE- EPA/PLAY
- -0.19
- OPP PPG
- 15.1
- OPP YPG
- 318.3
TEXANS
3-511TH SEED
- PLAYOFFPLAYOFF PROBABILITY
- 34%
- DIVISION TITLE
- 8%
- #1 SEED
- <1%
OFFENSE- EPA/PLAY
- +0.02
- PPG
- 26.1
- YPG
- 356.5
DEFENSE- EPA/PLAY
- -0.04
- OPP PPG
- 24.0
- OPP YPG
- 338.6
COLTS
2-713TH SEED
- PLAYOFFPLAYOFF PROBABILITY
- 1%
- DIVISION TITLE
- <1%
- #1 SEED
- 0%
OFFENSE- EPA/PLAY
- -0.17
- PPG
- 20.4
- YPG
- 288.9
DEFENSE- EPA/PLAY
- +0.03
- OPP PPG
- 27.7
- OPP YPG
- 361.8
TITANS
1-715TH SEED
- PLAYOFFPLAYOFF PROBABILITY
- <1%
- DIVISION TITLE
- <1%
- #1 SEED
- 0%
OFFENSE- EPA/PLAY
- -0.17
- PPG
- 18.0
- YPG
- 272.5
DEFENSE- EPA/PLAY
- +0.02
- OPP PPG
- 24.9
- OPP YPG
- 382.4


