

Miami Dolphins
CONF. RANKCONFERENCE RANK
14THPlayoff Probability


Playoff Probability
Offense

Defense

TEAM IDENTITY
OFFENSIVE IDENTITY
Team tendency statistics for Dolphins, grouped by category.
- 11P
- 57% How the Dolphins compare to the rest of the league on 11 personnel.
- 12P
- 9% How the Dolphins compare to the rest of the league on 12 personnel.
- 13P
- 0% How the Dolphins compare to the rest of the league on 13 personnel.
- 21P
- 25% How the Dolphins compare to the rest of the league on 21 personnel.
- CALLED PASS
- 58% How the Dolphins compare to the rest of the league on called pass rate.
- PLAY ACTION
- 38% How the Dolphins compare to the rest of the league on early down play action.
- MOTION
- 80% How the Dolphins compare to the rest of the league on motion.
- TEMPO
- 35.5s How the Dolphins compare to the rest of the league on tempo.
- QUICK PASS
- 39% How the Dolphins compare to the rest of the league on quick passing.
- IN-BREAKING
- 31% How the Dolphins compare to the rest of the league on in-breaking targets.
- OUT-BREAKING
- 35% How the Dolphins compare to the rest of the league on out-breaking targets.
- 10+ AIR YARDS
- 34% How the Dolphins compare to the rest of the league on downfield passing.
- INSIDE ZONE
- 14% How the Dolphins compare to the rest of the league on inside zone.
- OUTSIDE ZONE
- 23% How the Dolphins compare to the rest of the league on outside zone.
- GAP
- 36% How the Dolphins compare to the rest of the league on gap blocking.
- MAN
- 20% How the Dolphins compare to the rest of the league on man blocking.
- Offensive Personnel
- Play Selection

- Rushing Offense
- Passing Offense
| TRAIT | USAGE | Percentile | RANK | Details |
|---|---|---|---|---|
| 80% | 99th | 1st | ||
| 25% | 98th | 3rd | ||
| 36% | 98th | 1st |
| TEAM | SIMILARITY | |
|---|---|---|
 | LOS ANGELES CHARGERS | 81% |
 | TAMPA BAY BUCCANEERS | 78% |
 | MINNESOTA VIKINGS | 76% |



TEAM PERFORMANCE
POINT DIFFERENTIAL
- POINT DIFFERENTIAL
- NET EPA
- LEAGUE AVG

| WEEK | 6 | 10 | 11 | 12 | 13 | 14 | 15 | 16 | 17 | 18 | ||||||||
|---|---|---|---|---|---|---|---|---|---|---|---|---|---|---|---|---|---|---|
| OPP | @  Loss13-27 | @  Loss13-35 | vs  Loss10-24 | @  Loss10-15 | vs  Loss24-31 | Bye week | @  Win28-25 | vs  Loss19-24 | vs  Loss9-19 | @  Not played yet | @  Not played yet | vs Not played yet | @  Not played yet | vs  Not played yet | @  Not played yet | vs  Not played yet | vs Not played yet | @ Not played yet |
| NET EPA | -13.3 | -27.2 | -15.4 | -7.8 | -11.0 | No data | +2.2 | -7.3 | -8.3 | No data | No data | No data | No data | No data | No data | No data | No data | No data |
| PT DIFF | -14 | -22 | -14 | -5 | -7 | No data | 3 | -5 | -10 | No data | No data | No data | No data | No data | No data | No data | No data | No data |



AWS-powered AI helps turn player tracking data into advanced stats and deeper football insights you can explore in Next Gen Trends.
- 01COLLECTWatch: Capturing Every Snap
NFL Next Gen Stats tracks all 22 players and the ball, collecting more than 500 million data points each season to capture the movement behind every play.
- 02PROCESSWatch: From Snap to Stat
The NFL uses Amazon SageMaker to build machine learning models that turn raw tracking data into advanced stats that reveal how players and teams perform.
- 03DISTRIBUTEWatch: NGS Explained
Next Gen Trends brings those stats together to help fans compare all 32 teams, explore their strategies and track how the league evolves over time.


LATEST INSIGHTS
Explore the latest team trends and standout performances with insights from Next Gen Stats available only on NFL Pro.
CALEB DOUGLAS WR #7 - MIA vs
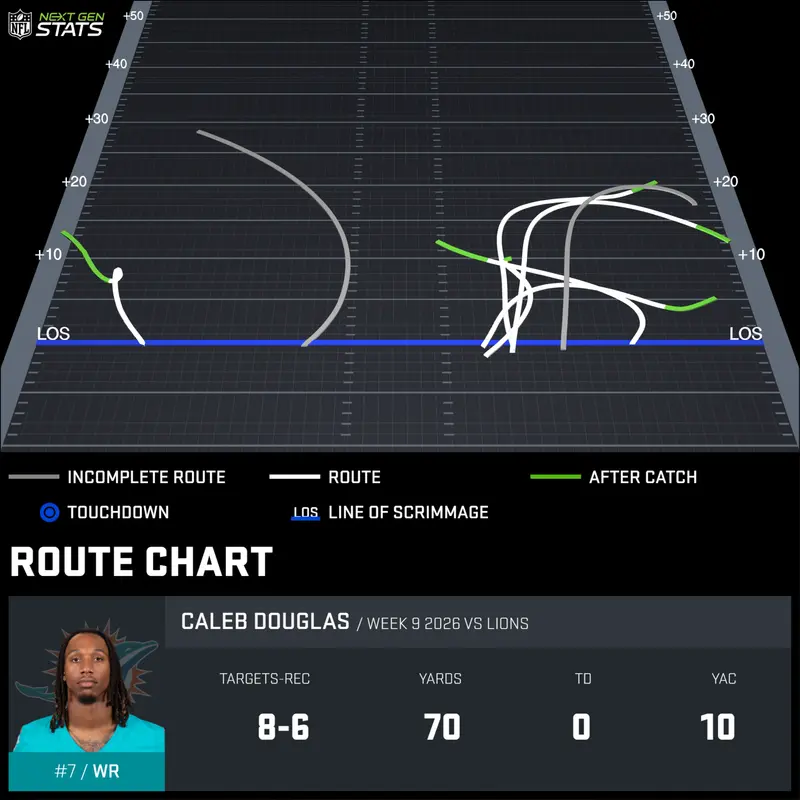
Caleb Douglas was targeted on all four of his out routes in Week 9 against the Lions, catching three of them for 38 yards.Douglas caught an additional pass for 12 yards outside the numbers, with his remaining three targets, two receptions, and 20 yards coming between the numbers. Douglas now has 128 yards on out routes (7th-most entering afternoon slate).
WEEK 9
NOV 8TH, 2026
CHOP ROBINSON OLB #44 - MIA vs
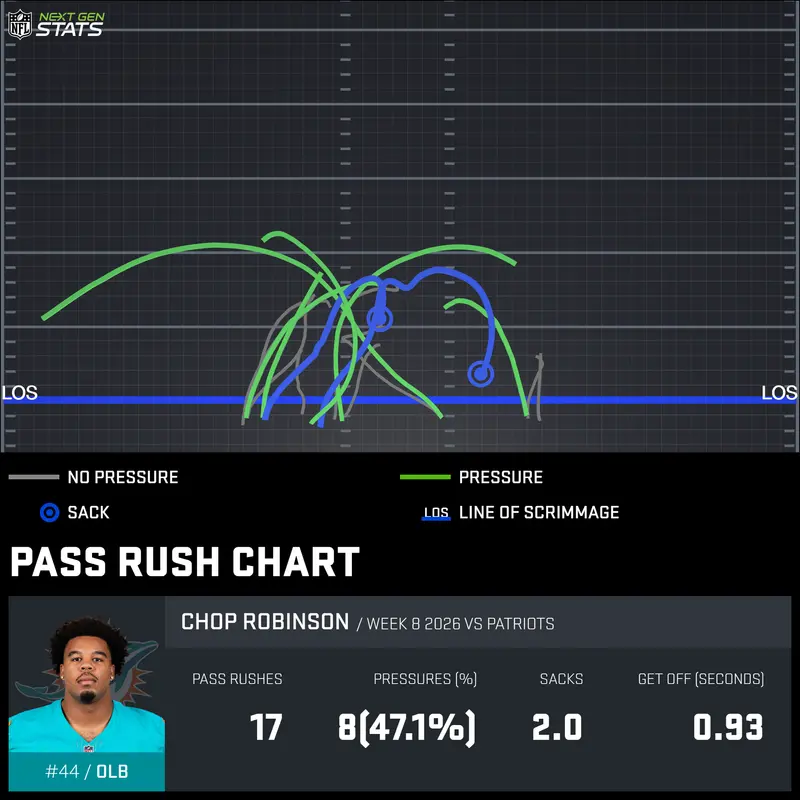
Chop Robinson totaled eight pressures on 17 pass rushes against the Patriots in Week 8 (47.1%), the second-highest pressure rate of any NFL defender this season (min. 10 pass rushes).Robinson recorded a team-high two sacks on these pressures, his highest pressure-to-sack rate (25.0%) this season. Robinson generated five of his pressures and a sack across eight matchups against Morgan Moses, with an additional pressure each against Will Campbell and Walter Rouse.
WEEK 8
NOV 1ST, 2026
MALIK WILLIS QB #2 - MIA vs
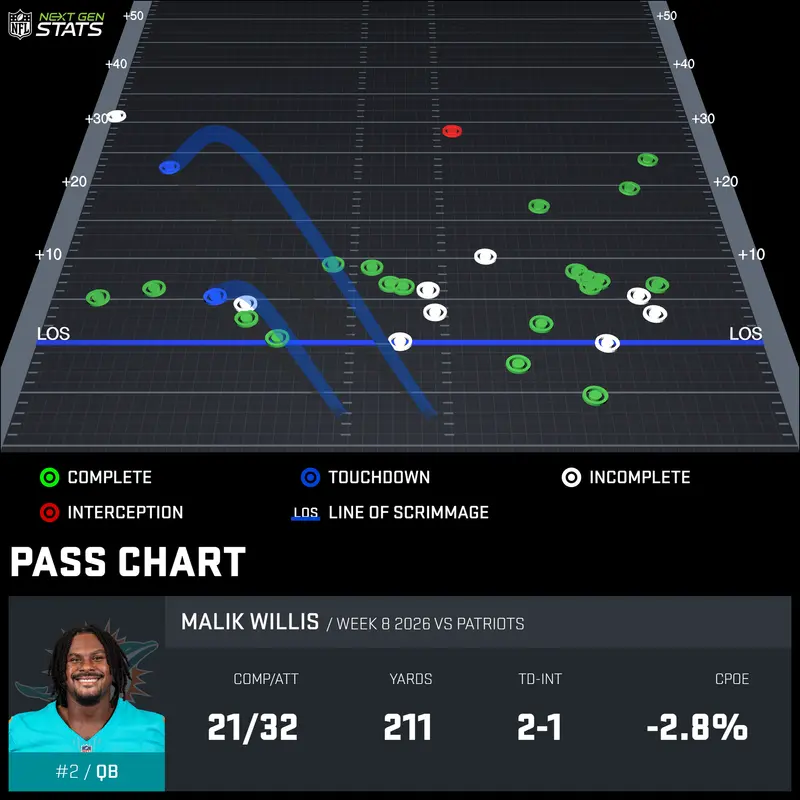
Malik Willis completed 21 of 32 passes for 211 yards with two touchdowns and one interception against the Patriots in Week 8.Willis averaged 2.70 seconds to throw, his second-fastest in a game this season, after entering Week 8 with the league's second-longest average time to throw (3.13 seconds). Getting the ball out quickly worked, as Willis completed 10 of 11 passes for 65 yards and a touchdown when throwing in under 2.5 seconds. When he held the ball longer than 2.5 seconds, he completed 11 of 21 for 146 yards, a touchdown and an interception.
WEEK 8
NOV 1ST, 2026
MALIK WILLIS QB #2 - MIA vs
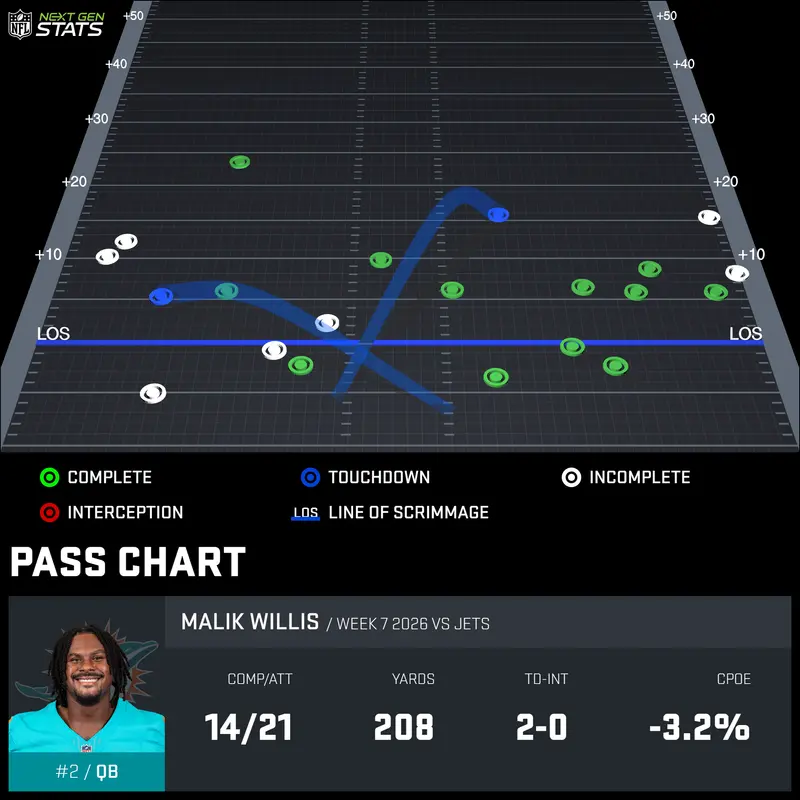
Malik Willis completed 7 of 9 passes under pressure for a career-high 138 yards and a touchdown in the Dolphins' first win in Week 7, adding three scramble runs for 20 yards and another score against pressure.Willis finished 11-for-16 for 184 yards and two touchdowns from inside the pocket (+12.2 EPA). He entered the game with -29.7 EPA and one touchdown from the pocket in his first five games this season.
WEEK 7
OCT 25TH, 2026


BILLS
7-11ST SEED
- PLAYOFFPLAYOFF PROBABILITY
- 99%
- DIVISION TITLE
- 94%
- #1 SEED
- 43%
OFFENSE- EPA/PLAY
- +0.11
- PPG
- 32.0
- YPG
- 386.4
DEFENSE- EPA/PLAY
- -0.05
- OPP PPG
- 23.4
- OPP YPG
- 330.4
PATRIOTS
5-47TH SEED
- PLAYOFFPLAYOFF PROBABILITY
- 56%
- DIVISION TITLE
- 6%
- #1 SEED
- <1%
OFFENSE- EPA/PLAY
- -0.01
- PPG
- 23.4
- YPG
- 369.4
DEFENSE- EPA/PLAY
- -0.01
- OPP PPG
- 23.0
- OPP YPG
- 328.6
JETS
2-712TH SEED
- PLAYOFFPLAYOFF PROBABILITY
- <1%
- DIVISION TITLE
- <1%
- #1 SEED
- 0%
OFFENSE- EPA/PLAY
- -0.05
- PPG
- 20.2
- YPG
- 309.9
DEFENSE- EPA/PLAY
- -0.02
- OPP PPG
- 24.8
- OPP YPG
- 325.8
DOLPHINS
1-714TH SEED
- PLAYOFFPLAYOFF PROBABILITY
- <1%
- DIVISION TITLE
- <1%
- #1 SEED
- 0%
OFFENSE- EPA/PLAY
- -0.11
- PPG
- 15.8
- YPG
- 282.3
DEFENSE- EPA/PLAY
- +0.08
- OPP PPG
- 25.0
- OPP YPG
- 326.1


