

San Francisco 49ers

CONF. RANKCONFERENCE RANK
1STPlayoff Probability


Playoff Probability
Offense

Defense

TEAM IDENTITY
OFFENSIVE IDENTITY
Team tendency statistics for 49ers, grouped by category.
- 11P
- 31% How the 49ers compare to the rest of the league on 11 personnel.
- 12P
- 19% How the 49ers compare to the rest of the league on 12 personnel.
- 13P
- 4% How the 49ers compare to the rest of the league on 13 personnel.
- 21P
- 35% How the 49ers compare to the rest of the league on 21 personnel.
- CALLED PASS
- 55% How the 49ers compare to the rest of the league on called pass rate.
- PLAY ACTION
- 32% How the 49ers compare to the rest of the league on early down play action.
- MOTION
- 77% How the 49ers compare to the rest of the league on motion.
- TEMPO
- 34.3s How the 49ers compare to the rest of the league on tempo.
- QUICK PASS
- 34% How the 49ers compare to the rest of the league on quick passing.
- IN-BREAKING
- 40% How the 49ers compare to the rest of the league on in-breaking targets.
- OUT-BREAKING
- 28% How the 49ers compare to the rest of the league on out-breaking targets.
- 10+ AIR YARDS
- 37% How the 49ers compare to the rest of the league on downfield passing.
- INSIDE ZONE
- 19% How the 49ers compare to the rest of the league on inside zone.
- OUTSIDE ZONE
- 35% How the 49ers compare to the rest of the league on outside zone.
- GAP
- 19% How the 49ers compare to the rest of the league on gap blocking.
- MAN
- 15% How the 49ers compare to the rest of the league on man blocking.
- Offensive Personnel
- Play Selection

- Rushing Offense
- Passing Offense
| TRAIT | USAGE | Percentile | RANK | Details |
|---|---|---|---|---|
| 35% | 100th | 1st | ||
| 77% | 96th | 2nd | ||
| 40% | 91st | 2nd |
| TEAM | SIMILARITY | |
|---|---|---|
 | SEATTLE SEAHAWKS | 78% |
 | LAS VEGAS RAIDERS | 77% |
 | LOS ANGELES CHARGERS | 77% |



TEAM PERFORMANCE
POINT DIFFERENTIAL
- POINT DIFFERENTIAL
- NET EPA
- LEAGUE AVG

| WEEK | 8 | 10 | 11 | 12 | 13 | 14 | 15 | 16 | 17 | 18 | ||||||||
|---|---|---|---|---|---|---|---|---|---|---|---|---|---|---|---|---|---|---|
| OPP | @  Win27-7 | vs  Win35-13 | vs  Win36-30 | vs  Win24-14 | @  Win32-29 | vs  Win23-17 | @  Loss20-29 | Bye week | vs  Win38-17 | @  Not played yet | vs  Not played yet | vs Not played yet | @  Not played yet | vs Not played yet | @  Not played yet | @  Not played yet | vs  Not played yet | @ Not played yet |
| NET EPA | +26.3 | +27.2 | +13.8 | +2.4 | +15.7 | +15.2 | -4.7 | No data | +34.0 | No data | No data | No data | No data | No data | No data | No data | No data | No data |
| PT DIFF | 20 | 22 | 6 | 10 | 3 | 6 | -9 | No data | 21 | No data | No data | No data | No data | No data | No data | No data | No data | No data |



AWS-powered AI helps turn player tracking data into advanced stats and deeper football insights you can explore in Next Gen Trends.
- 01COLLECTWatch: Capturing Every Snap
NFL Next Gen Stats tracks all 22 players and the ball, collecting more than 500 million data points each season to capture the movement behind every play.
- 02PROCESSWatch: From Snap to Stat
The NFL uses Amazon SageMaker to build machine learning models that turn raw tracking data into advanced stats that reveal how players and teams perform.
- 03DISTRIBUTEWatch: NGS Explained
Next Gen Trends brings those stats together to help fans compare all 32 teams, explore their strategies and track how the league evolves over time.

LATEST INSIGHTS
Explore the latest team trends and standout performances with insights from Next Gen Stats available only on NFL Pro.
BROCK PURDY QB #13 - SF vs
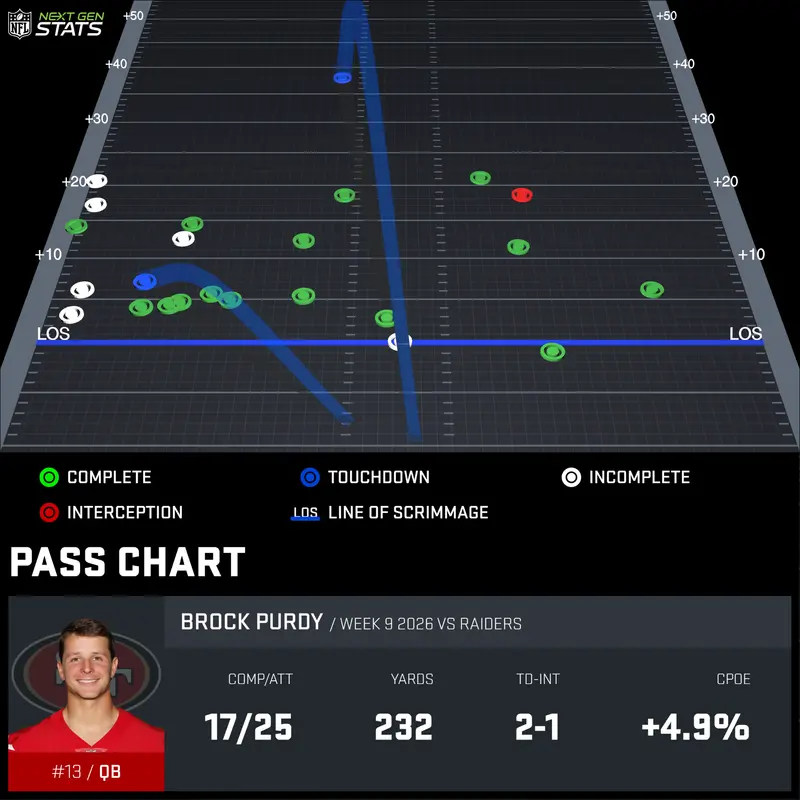
Brock Purdy completed 17 of his 25 pass attempts for two touchdowns in a Week 9 win against the Raiders, completing 7 of his 11 pass attempts for 153 yards and one touchdown on passes that traveled at least 10 air yards.Purdy's 44.0% downfield throw rate is his second highest rate of the season (Wk 2 vs Dolphins, 45.5%), and with only 31.0% of his passing yards coming after the catch, this marks his second lowest rate of the season (Wk 3 vs Cardinals, 29.6%). On the ground that he recorded a season-high 4 scramble attempts for 36 yards and one touchdown.
WEEK 9
NOV 8TH, 2026
JORDAN WATKINS WR #17 - SF vs
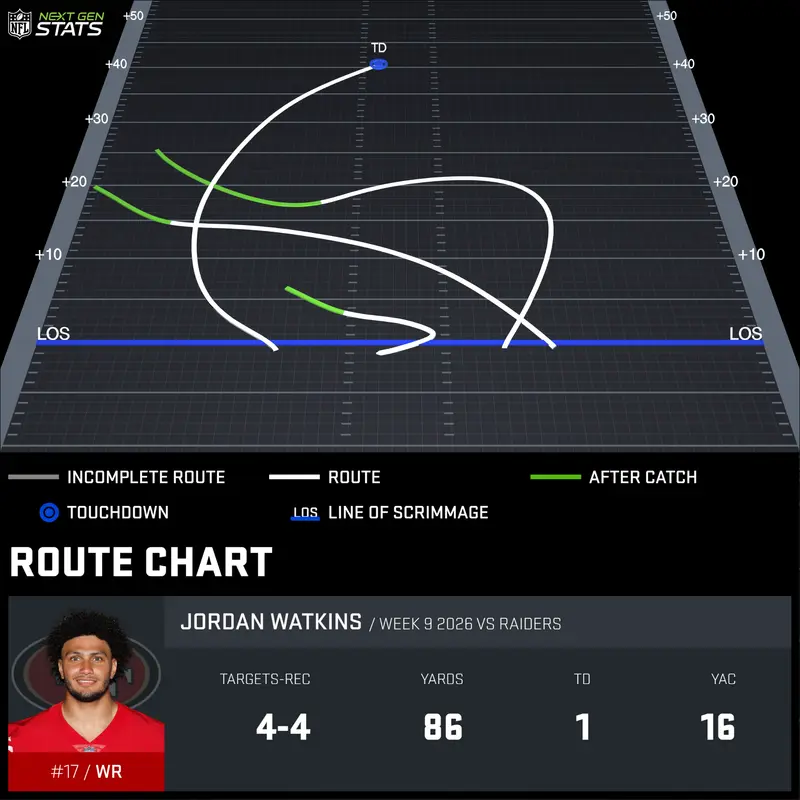
Jordan Watkins caught all four of his receiving targets for 84 yards (career-high) and his first career touchdown in a win against the Raiders; his 17.4 average air yards per target were a season high.Despite finishing tied for second in target share on the day (17.4%), Watkins led the team in receiving yards and finished with +40 receiving yards over expected; no other 49ers finished with more than +11 (Brandin Cooks). He also led the team with 3.3 yards per route run (minimum 5 routes).
WEEK 9
NOV 8TH, 2026
TRENT WILLIAMS T #71 - SF vs
Trent Williams allowed just two pressures on 30 pass blocks (6.7%) in a Week 9 win against the Raiders, however, for just the second time this season he allowed a sack.Against Williams, Malcolm Koonce earned a pressure while Maxx Crosby earned the only sack allowed by a 49ers offensive lineman today.

WEEK 9
NOV 8TH, 2026
GEORGE KITTLE TE #85 - SF vs
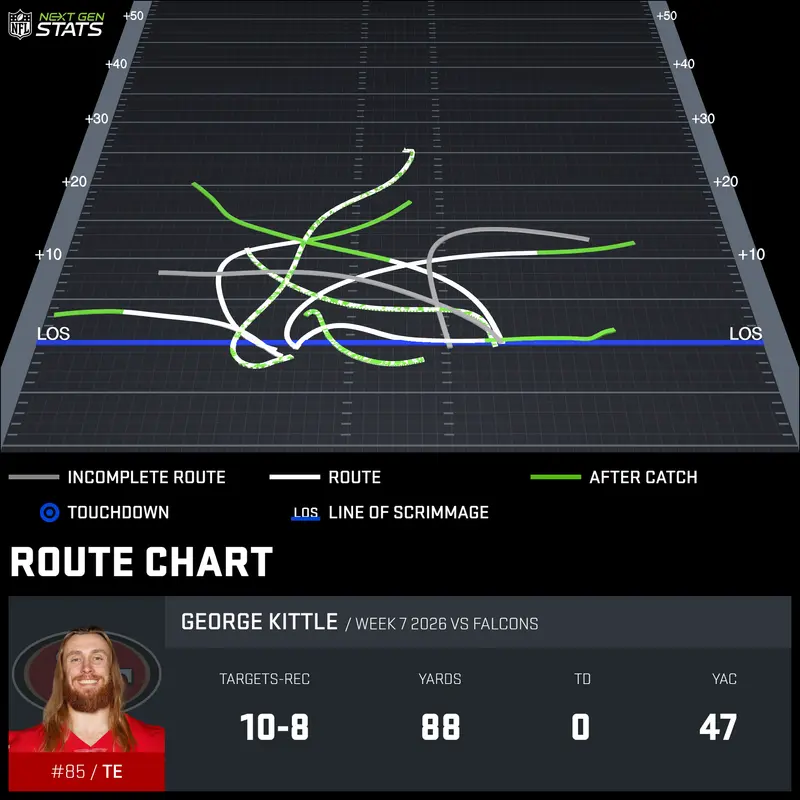
George Kittle totaled team-highs in targets (10), receptions (8), and receiving yards (88) across 34 routes run in Week 7 against the Falcons, including 47 yards after the catch.Despite the 49ers having just a 2.7% chance to win the game prior to the play, Kittle gained 22 yards before fumbling with 57 seconds remaining in the fourth quarter, sealing the game for the Falcons. Entering the Sunday afternoon slate of Week 7, Kittle leads all tight ends league-wide with 425 receiving yards and 228 yards after the catch. Coming off a torn Achilles suffered last season, Kittle (76.7%) is the only 49ers skill player (RB, WR & TE) to have played on more than three-quarters of his team's offensive snaps this season.
WEEK 7
OCT 25TH, 2026


49ERS
7-11ST SEED
- PLAYOFFPLAYOFF PROBABILITY
- 94%
- DIVISION TITLE
- 80%
- #1 SEED
- 40%
OFFENSE- EPA/PLAY
- +0.14
- PPG
- 29.4
- YPG
- 376.8
DEFENSE- EPA/PLAY
- -0.13
- OPP PPG
- 19.5
- OPP YPG
- 291.9
SEAHAWKS
5-48TH SEED
- PLAYOFFPLAYOFF PROBABILITY
- 50%
- DIVISION TITLE
- 12%
- #1 SEED
- 2%
OFFENSE- EPA/PLAY
- -0.09
- PPG
- 22.4
- YPG
- 327.8
DEFENSE- EPA/PLAY
- -0.16
- OPP PPG
- 18.0
- OPP YPG
- 244.2
RAMS
5-49TH SEED
- PLAYOFFPLAYOFF PROBABILITY
- 47%
- DIVISION TITLE
- 9%
- #1 SEED
- 3%
OFFENSE- EPA/PLAY
- +0.01
- PPG
- 23.8
- YPG
- 379.8
DEFENSE- EPA/PLAY
- -0.15
- OPP PPG
- 20.1
- OPP YPG
- 302.4
CARDINALS
3-614TH SEED
- PLAYOFFPLAYOFF PROBABILITY
- <1%
- DIVISION TITLE
- <1%
- #1 SEED
- 0%
OFFENSE- EPA/PLAY
- -0.09
- PPG
- 19.8
- YPG
- 318.0
DEFENSE- EPA/PLAY
- +0.04
- OPP PPG
- 28.3
- OPP YPG
- 337.3


